
Distributed Systems
Distributed systems solved the problem of vertical scaling as now we can scale horizontally and can process a bigger problem by dividing it into smaller chunks in parallel. But also as we scale a distributed platform there are a lot of new corner cases or scenarios come into the play and sometimes we are not able to track the slowness or the weird behaviour of jobs, A simple group by job can take hours to run in a distributed system due to Skew or may be due to the Murmur3 Hashing of spark Partitioner as it is sending a lot of tasks to the same executor while not using the parallelism even with dynamic allocation enabled.
Apache Spark is a distributed processing framework, It is used industry-wide for big data processing and it can run on any resource scheduler available in the market right now. You can name it Mesos, Standalone, Yarn or Kubernetes, and a spark version is available.
Profiling
Profiling is an aspect of computer programming with which we can measure the time and space complexity of a job. Profiling for a computer program can be done for different components of a job, some of them are
- IO Profiling
- Method Profiling
- JVM Profiling
I will leave the IO and Method Profiling for later and will focus on the JVM profiling for the spark jobs this time.
Uber JVM Profiling for Spark
Uber Engineering team did great work by writing an open-source JVM profiler for distributed systems. it is an open-source project and we can clone and build it locally to profile the spark jobs.
Build for Influx
git clone https://github.com/uber-common/jvm-profiler.git
For Influx Database configurations, we can pass on a YAML configuration file with influx database credentials to the spark job.
influxdb.yaml
db {
 host=
 port=
 database=
 username=
 password=
}
Use “-P influxdb” for influx Database profile
mvn -P influxdb clean package
Add Below lines to the Spark-submit Command while starting a new job
JVM_PROFILER_JAR="/path/to/jar/jvm-profiler-0.0.9.jar"
--conf "spark.jars=${JVM_PROFILER_JAR}"
--conf "spark.executor.extraJavaOptions=-javaagent:${JVM_PROFILER_JAR}=reporter=com.uber.profiling.reporters.InfluxDBOutputReporter,tag=influxdb,configProvider=com.uber.profiling.YamlConfigProvider,configFile=influxdb.yaml,metricInterval=5000,sampleInterval=5000,ioProfiling=true"
–conf “spark.jars=${JVM_PROFILER_JAR}”
First Line will add the uber profiling jar to the spark job and the jar file will be sent to all the executors in the job.
–conf “spark.driver.extraJavaOptions=javaagent:${JVM_PROFILER_JAR}=
reporter=com.uber.profiling.reporters.InfluxDBOutputReporter,
configProvider=com.uber.profiling.YamlConfigProvider,
configFile=influxdb.yaml,
metricInterval=5000,
sampleInterval=5000,
ioProfiling=true”
Second-line will add the jar to the Driver JVM process using extra java options as the reporter be ‘com.uber.profiling.reporters.InfluxDBOutputReporter’, YAML config parser will be ‘com.uber.profiling.YamlConfigProvider’, Configuration file for influx database will be ‘influxdb.yaml’ Metric and Sample Interval for the profiling will be 5000 milliseconds and we have enabled the io profiling as well.
Data Visualization
Once Spark submits the job the profiler will start sending the metrics to the influx Database, and it will create below four measurements in the database.
CPUandMemory
Profiler contains all the JVM metrics for the job incusing the GC metrics
IO
Profiler collects all the information related to IO metrics rchar, wchar, read_bytes, and write_bytes.
StackTrace
Profiler class reads the stack traces from the given JVM buffer and sends out the metrics using the given reporter.
ProcessInfo
Profiler collects all the information related to the JVM process as java version, cmdline options, appJar, JVM arguments, xmxBytes, etc.
All the measurements have some common metrics as below for the process and we can graph and co-relate the metrics from all the measurements
- Machine Host,
- Role (Executor/Driver),
- ProcessUUID (tag),
- appID(Spark Job ID),
- Name(OSprocessId@Hostname)
We can use the ProcessInfo table to grab the application ID’s for the jobs and then select the app ID as a variable for the flexibility of selecting the profiling information by application ID. We have divided the visualization by Driver and Executor ids.
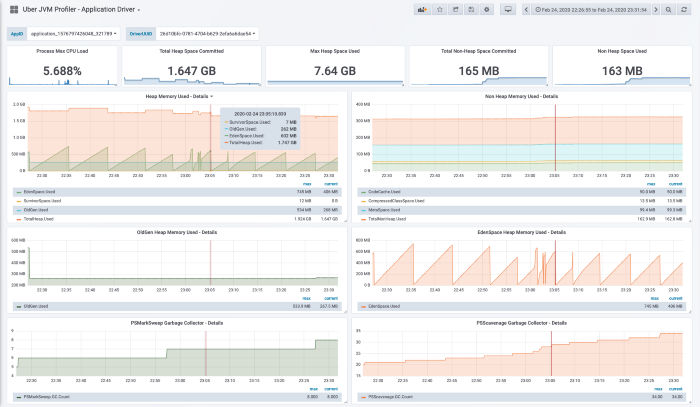
Below is a Screenshot for the Driver JVM profiling for a spark job.

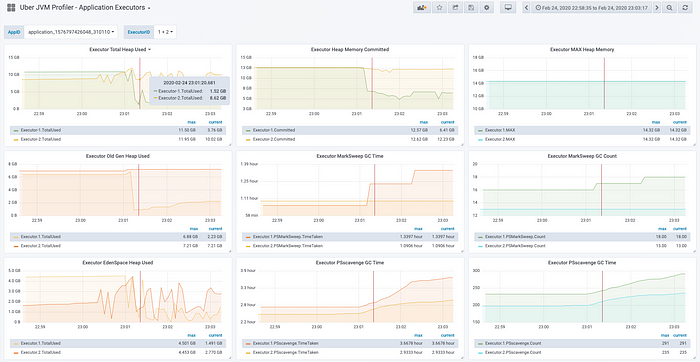
However, I found it a little bit difficult to analyze the Executors profiling information using the process UUID tag as we were not able to relate the executor JVM information with Spark UI in case of multiple executors running on the same machine.
To solve this problem I have added a new tag Spark UI Executor ID to the influx DB reporter and all the above 4 profiler classes, Now we are reporting the JVM profiling metrics by executor ID and we can see the rest of the information as No of tasks, task skew from UI for a particular executor.
It helped a lot in co-relating the profiling metrics with the UI data and helped to optimize the bottleneck points in the job.
In the below screenshot, I have selected Executor ID 1 and 2 and we can check the related information for the executors from UI.
I have shared my concern with the Uber engineer team if there is any other way to get spark executor process UUID to Spark Executor UI id mapping from currently available dataset else I will raise an MR to include my changes in the JVM profiler code.
I am working in Big data for the last 10 years and always thought of sharing some interesting work that I or my team has done over the years. We almost process 100 TB data every day and always touch the new corner cases. I will try to share the experience with others, as it might help someone. This is me writing an article first time, please feel free to review and let me know if I can change something and make it better in the future.
Reference Links:
Executor ID JVM Profiler: https://github.com/dataholic99/jvm-profiler-executorid-tag